Does Vibe Coding Produce Worse Code?

1,819 repos, 5 groups, 10 scanners. Splitting vibe-coded and indie developers by CI/CD adoption reveals that the real quality divider isn’t AI — it’s engineering discipline.
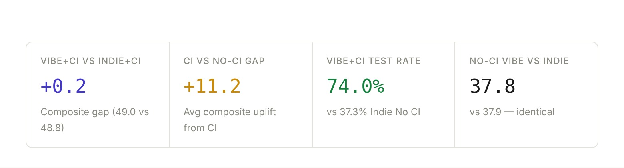
Bottom line: CI/CD presence is a stronger predictor of code quality than whether AI tools were used. Vibe + CI and Indie + CI are statistically indistinguishable (composite 49.0 vs 48.8), and both match Established OSS (51.0). Without CI, both groups drop to ~37–38 — identical to each other and 11 points below their CI counterparts. The question isn’t “does AI make worse code?” — it’s “does the developer invest in engineering practices?”
Methodology & Group Definitions
We reviewed 1,819 GitHub repos. We then scanned each repo using ten open source quality scanners. This data was then compiled and scored. We further broke the repos up into three groups: Vibe Coded (significant presence of AI tools), Indie (repos by one person or a small team without community support) and Established OSS (repos with a significant number of contributors, stars, etc.). We further split the Indie and Vibe Coded segments based on the presence or lack of CI/CD in the repo.
1. Composite Quality Score
Weighted across all dimensions: complexity (15%), testing (15%), maturity (15%), documentation (10%), commit hygiene (10%), security (10%), smells (10%), CI (5%), dependency pinning (5%), lint (5%).
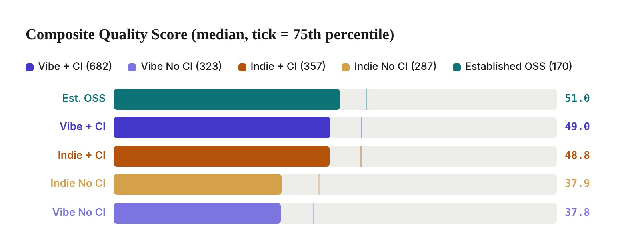
Bar = median. Thin tick = 75th percentile. Zero repos in any group exceeded 80.
Two tiers, not five.
The data collapses into two clusters: repos with CI (49–51 median) and repos without CI (37–38 median). Whether AI wrote the code is invisible within each tier. The 0.2-point gap between Vibe+CI and Indie+CI is noise; the 11-point gap between CI and no-CI is signal. When controlled for project size (1k–50k LOC), Vibe+CI, Indie+CI, and Established OSS all converge at 48.3–48.4.
2. Code Complexity
Cognitive complexity density (lower = better), average function complexity, and code smells per 1,000 lines.
| Metric (median) | Vibe+CI | Vibe−CI | Indie+CI | Indie−CI | OSS |
|---|---|---|---|---|---|
| Complexity Density | 0.223 | 0.252 | 0.226 | 0.207 | 0.191 |
| Avg Func Complexity | 4.21 | 4.31 | 4.35 | 3.93 | 3.85 |
| Smell Density / 1k | 7.58 | 7.85 | 8.13 | 7.02 | 7.20 |
| Median qlty LOC | 16,311 | 3,640 | 5,176 | 1,888 | 36,852 |
Complexity density is nearly flat across all five groups.
The spread is 0.191–0.252 — a 32% range on a metric where real differences start at 2x. Vibe+CI (0.223) and Indie+CI (0.226) are within 1.3% of each other. The no-CI groups show slightly divergent patterns: Vibe No CI is denser (0.252), while Indie No CI is actually the second-lowest (0.207) — likely because those repos are very small (median 1,888 LOC) and haven’t accumulated complexity yet.
3. Python Lint Violations
Ruff analysis of Python repos. Violation density = violations per 1,000 lines of Python code. Lower is better.
| Metric (median) | Vibe+CI | Vibe−CI | Indie+CI | Indie−CI | OSS |
|---|---|---|---|---|---|
| Violation Density / 1k | 16.23 | 22.16 | 18.36 | 23.57 | 18.04 |
Vibe+CI Python is the cleanest by lint density.
16.23 violations per 1k LOC, edging out Indie+CI (18.36) and Established OSS (18.04). Without CI, both groups degrade similarly: Vibe−CI rises to 22.16, Indie−CI to 23.57. AI code assistants produce style-consistent Python — but only when the developer also maintains CI discipline.
4. Testing
Test file presence and test-to-source LOC ratio. CI presence dramatically affects whether tests exist at all.
Has Any Test Files
| Among tested repos | Vibe+CI | Vibe−CI | Indie+CI | Indie−CI | OSS |
|---|---|---|---|---|---|
| Median Test Files | 29 | 7 | 10 | 5 | 67 |
| Test/Source Ratio | 0.298 | 0.241 | 0.297 | 0.248 | 0.327 |
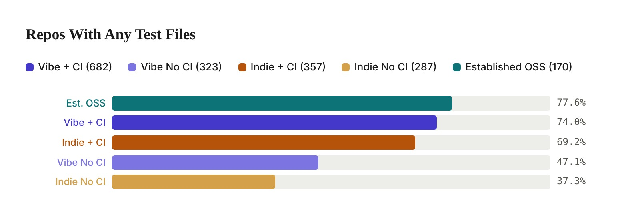
CI creates a 30-point test-presence gap.
74% of Vibe+CI repos have tests vs 47.1% without CI — a 27-point swing. For indie, it’s even steeper: 69.2% vs 37.3% (32 points). Within the CI tier, vibe-coded repos are slightly more likely to have tests than indie (+4.8pp) and have nearly 3x the median test file count (29 vs 10), suggesting AI tools scaffold test infrastructure readily.
5. Project Structure & Maturity
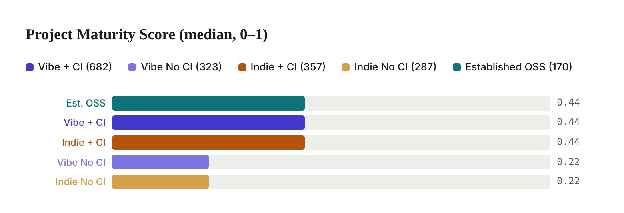
Composite maturity score (0–1) based on .gitignore, .editorconfig, Docker, CI, license, linter configs, env examples, and code organization.
Maturity Score
| Indicator | Vibe+CI | Vibe−CI | Indie+CI | Indie−CI | OSS |
|---|---|---|---|---|---|
| .gitignore | 99.3% | 86.7% | 96.1% | 71.4% | 98.2% |
| Dockerfile | 9.4% | 3.4% | 7.3% | 3.1% | 18.8% |
| .env.example | 13.8% | 6.8% | 10.4% | 7.3% | 12.9% |
| Linter Configs | 0.32 | 0.12 | 0.29 | 0.11 | 0.49 |
Three groups tied at 0.44; two tied at 0.22.
Maturity score splits cleanly on CI. The CI trio (Vibe+CI, Indie+CI, OSS) is identical at 0.44 median. Without CI, both groups drop to 0.22 — also identical to each other. Notable: 28.6% of Indie No CI repos don’t even have a .gitignore, vs only 0.7% of Vibe+CI. AI tools reliably scaffold project hygiene when the developer cares enough to set up CI.
6. Documentation
| Metric (median) | Vibe+CI | Vibe−CI | Indie+CI | Indie−CI | OSS |
|---|---|---|---|---|---|
| README Lines | 218 | 153 | 185 | 114 | 220 |
| Doc Completeness | 0.30 | 0.20 | 0.30 | 0.20 | 0.30 |
| Has Code Blocks | 93.8% | 90.4% | 94.4% | 74.4% | 91.8% |
| Has Changelog | 41.2% | 13.9% | 29.4% | 9.8% | 38.2% |
Vibe+CI produces the longest READMEs and highest changelog rate.
218 median lines (matching OSS at 220), with 41.2% having a changelog — higher than every other group including OSS (38.2%). Indie No CI is the documentation laggard: only 114 median lines and 74.4% code block rate (vs 90%+ everywhere else). The no-CI groups consistently underperform on docs, regardless of AI usage.
7. Dependency Health
| Metric | Vibe+CI | Vibe−CI | Indie+CI | Indie−CI | OSS |
|---|---|---|---|---|---|
| Has Lockfile | 78.5% | 62.0% | 71.5% | 53.8% | 71.0% |
| Pinning Ratio (mean) | 0.74 | 0.75 | 0.76 | 0.60 | 0.58 |
| Mean Vulns | 2.19 | 1.36 | 1.96 | 1.33 | 3.79 |
Lockfile adoption tracks CI presence, not AI usage.
Vibe+CI leads at 78.5%, and within each development style, CI adds 13–18 percentage points of lockfile adoption. Vulnerability counts are higher in CI groups — a size confound (larger projects have more transitive deps, not worse security). OSS has the most mean vulnerabilities (3.79) because it has the largest dependency trees.
8. Type Safety
| Metric | Vibe+CI | Vibe−CI | Indie+CI | Indie−CI | OSS |
|---|---|---|---|---|---|
| TS Strict Mode | 71.4% | 62.3% | 73.3% | 55.8% | 55.8% |
| Python Annotation % | 8.0% | 0.5% | 15.0% | 1.0% | 18.0% |
| Has Type Checker | 4.9% | 0.7% | 3.3% | 0.0% | 12.0% |
Indie+CI leads TypeScript strict mode; OSS leads Python typing.
This is one area where human practice outpaces AI assistance. Indie+CI has the highest TS strict adoption (73.3%) and the second-highest Python annotation rate (15% median). AI-written Python code is notably under-annotated (Vibe+CI at 8%, Vibe−CI at 0.5%), while established OSS leads Python typing at 18% with 12% type checker usage — 2–6x the rate of any other group.
9. Commit Hygiene
| Metric (median) | Vibe+CI | Vibe−CI | Indie+CI | Indie−CI | OSS |
|---|---|---|---|---|---|
| Commits | 100 | 18 | 28 | 8 | 100 |
| Unique Authors | 2 | 1 | 1 | 1 | 6 |
| Conventional % | 32.0% | 15.5% | 32.3% | 14.9% | 35.6% |
| AI Co-Author % | 37.0% | 77.8% | 0.0% | 0.0% | 2.0% |
| Active Days | 7 | 3 | 5 | 3 | 13 |
Vibe+CI hits the 100-commit cap; Vibe No CI is 78% AI-authored.
Vibe+CI repos are so active they hit the 100-commit analysis limit (matching OSS), with 3.6x the commits of Indie+CI (100 vs 28). Paradoxically, the AI co-author ratio is lower for Vibe+CI (37%) than Vibe No CI (78%), suggesting that developers who set up CI also write more commits themselves alongside AI — they’re collaborators, not delegators. Conventional commit adoption is identical between Vibe+CI and Indie+CI (32%).
10. Security Scan Grades
WhiteRabbit scanner grades (A+ through F). Larger repos accumulate more findings mechanically.
| Group | A+ % | D/F % | Med. Findings | Med. LOC |
|---|---|---|---|---|
| Indie No CI | 36.8% | 19.0% | 2 | 1,888 |
| Vibe No CI | 31.1% | 29.5% | 3 | 3,640 |
| Indie + CI | 2.6% | 35.4% | 8 | 5,176 |
| Vibe + CI | 2.3% | 51.4% | 16 | 16,311 |
| Est. OSS | 4.2% | 68.8% | 37 | 36,852 |
Security grades track repo size, not quality.
Sorted by findings, the groups are in near-perfect LOC order. Indie No CI (smallest repos, median 1,888 LOC) gets the most A+ grades (36.8%); OSS (largest, 36,852) gets the worst (68.8% D/F). This confirms security findings are a size proxy: more code surface area = more mechanical detections. CI groups score worse because CI-backed projects are also larger.
11. Size-Controlled Validation
Restricting to repos with 1,000–50,000 lines of code removes the size confound. If the quality differences are real, they should persist here.
| 1k–50k LOC only | Vibe+CI (470) | Vibe−CI (219) | Indie+CI (264) | Indie−CI (164) | OSS (77) |
|---|---|---|---|---|---|
| Complexity Density | 0.239 | 0.266 | 0.234 | 0.245 | 0.233 |
| Smell Density | 7.81 | 8.50 | 8.79 | 8.38 | 8.18 |
| Avg Func Complexity | 4.40 | 4.52 | 4.46 | 4.56 | 4.31 |
| Has Tests | 73.6% | 51.6% | 72.3% | 45.7% | 75.3% |
| Maturity Score | 0.44 | 0.22 | 0.44 | 0.33 | 0.44 |
| Composite Score | 48.3 | 36.0 | 48.4 | 35.6 | 48.4 |
Size-controlled: three-way tie at 48.3–48.4 among CI groups.
With size removed as a confound, Vibe+CI (48.3), Indie+CI (48.4), and Established OSS (48.4) are indistinguishable. The no-CI groups remain identical to each other too (36.0 vs 35.6). Every metric — complexity, smell density, function complexity, test presence, maturity — converges within its CI tier. This is the strongest evidence that AI vs human authorship is not a meaningful quality axis.
12. CI + Tests: The Strongest Single Predictor
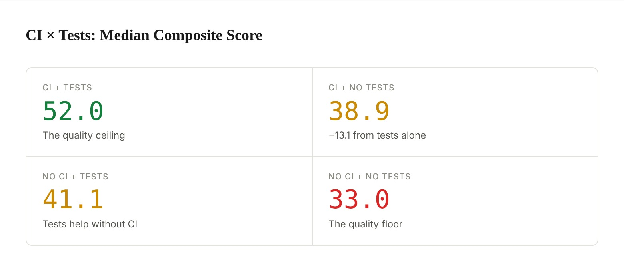
CI/CD is the strongest quality predictor we’ve found — but combining it with test presence produces an even wider gap. The CI × Tests interaction is the single most powerful predictor in the dataset, with a 19-point median spread.
Practice Combinations (with CI)
| Practice Pair | Median Score | vs CI-Only Baseline |
|---|---|---|
| Conventional Commits + CI | 55.7 | +16.8 |
| Lockfile + CI | 52.6 | +13.7 |
| Tests + CI | 52.0 | +13.1 |
| CI only (no tests) | 38.9 | — |
Each practice stacks: CI alone isn’t enough.
CI + Tests (52.0) is 13 points above CI alone (38.9). Conventional commits push even higher (55.7) — these are developers who structure their process, not just toggle one switch. The gap between the quality ceiling (CI + Tests, 52.0) and floor (No CI + No Tests, 33.0) is 19 points, making this the single widest predictor spread in the dataset. Engineering practices compound.
13. Language Choice as Quality Predictor
Primary language shows a 12.7-point median spread — surprisingly powerful. Languages with built-in tooling ecosystems (TypeScript’s tsc, Rust’s cargo) cluster at the top.
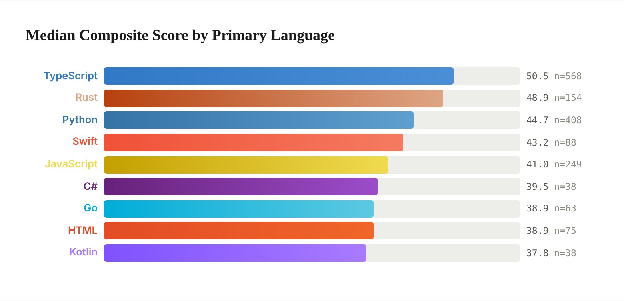
Bar width proportional to composite score. Only languages with n ≥ 30 shown. “HTML” = repos where HTML is the primary language (typically static sites or simple web apps).
TypeScript tops the chart; the TS/JS gap (9.5 pts) is the largest within a language family.
TypeScript (50.5) beats JavaScript (41.0) by 9.5 points — the single biggest within-family gap, and larger than the CI uplift for some groups. This isn’t just types: TS repos also have higher CI adoption, more lockfile usage, and more tests. Rust (48.9) benefits similarly from cargo’s built-in testing, linting, and dependency management. Languages that bundle quality tooling produce measurably better projects — the toolchain shapes the practice.
14. AI Tool Choice Within Vibe-Coded Repos
Among the 1,140 vibe-coded repos with quality scans, does the choice of AI tool matter? Delta = median composite with tool minus median without.
Tool Presence vs Absence
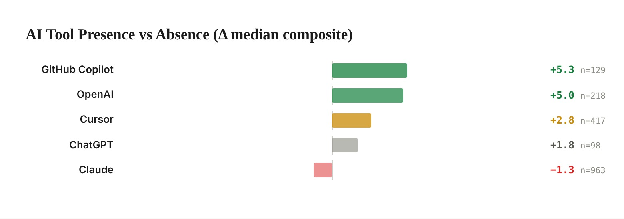
Delta = median composite of repos mentioning this tool minus repos not mentioning it. Tools overlap — many repos use multiple AI tools. Claude’s negative delta reflects that 84% of all vibe repos mention Claude, making “without Claude” a tiny, atypical sample.
Claude × Cursor Combination
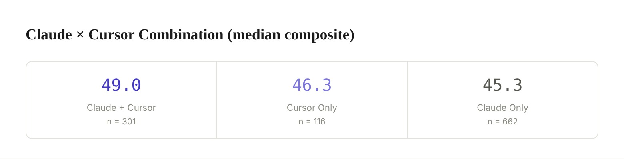
Multi-tool developers score higher — tooling breadth is a discipline signal.
Copilot (+5.3) and OpenAI (+5.0) show the largest positive deltas, but this likely reflects that developers who add a second or third tool already have stronger engineering habits. The Claude + Cursor combination (49.0) outscores either tool alone (Claude-only 45.3, Cursor-only 46.3) by 2.7–3.7 points. More tools used correlates with higher quality not because the tools are better together, but because the kind of developer who evaluates multiple tools is the kind who also sets up CI and writes tests.
15. Key Takeaways
| 0.2 — Composite point gap. Vibe+CI (49.0) vs Indie+CI (48.8). Statistically identical. | 11.2 — Composite point uplift. Average gain from having CI/CD, across both vibe and indie groups. |
|---|
1. CI/CD is a 20x stronger quality predictor than AI authorship.
The CI vs no-CI gap (~11 points) dwarfs the vibe vs indie gap within tiers (~0.2 points). Whether the code was written by AI or a human is invisible once you control for CI presence.
2. Vibe+CI matches Established OSS on every structural metric.
Maturity score (0.44 = 0.44), test presence (74% vs 77.6%), conventional commits (32% vs 35.6%), composite (49 vs 51). The only gap is multi-author collaboration and type checker usage — process practices that come from team scale, not tooling.
3. Without CI, AI doesn’t save you.
Vibe No CI (37.8) and Indie No CI (37.9) are identical. AI tools produce larger repos without CI (median 3,640 LOC vs 1,888) but at the same quality density. More code at the same quality is more technical debt, not more value.
4. AI-written Python is under-typed.
The one area where human-authored code clearly wins: Indie+CI has 15% median annotation ratio vs Vibe+CI’s 8%, and OSS leads at 18%. Current AI tools produce functional Python without type hints. TS strict mode is the opposite story — AI repos are slightly more strict.
5. Vibe+CI developers collaborate with AI; Vibe No CI delegates to AI.
AI co-author ratio is 37% for Vibe+CI (human commits are the majority) vs 78% for Vibe No CI. The CI group has more commits (100 vs 18), more active days (7 vs 3), and more unique authors (2 vs 1). They use AI as a tool; the no-CI group uses it as a replacement.
6. Practices compound: CI + Tests + conventional commits = 55.7 median.
The strongest single predictor is CI × Tests (19-point spread). Language choice adds another 12.7 points (TypeScript 50.5 vs Kotlin 37.8). Multi-tool AI users score 3.7 points above single-tool users. None of these are about which AI wrote the code — they’re all about whether the developer invests in process.
Analysis performed by Claude on October 24, 2026. Data: 2,062 repos from Cronbox master list, 1,935 with quality scans completed. Scanners: qlty v0.651, ruff v0.16.8, plus built-in analyzers for tests, deps, readme, typesafety, structure, commits, and deps_audit. WhiteRabbit v0.1.1 for security.